We explain, not just deliver
Every engagement includes a walkthrough of what was fitted, why that model and not another, and what the estimates mean for your selection decisions. Students get a full teaching session.
 Consulting
Trial data, marker data, or both — analysed on PlantNura’s own platform by people who work in plant breeding, explained in plain language, and delivered as a complete report with publication-ready figures and a teaching deck. No black boxes, and nothing you cannot defend.
Plant scientists understand their biology. What usually stands between the field book and the conclusion is a licence fee, a method nobody explained, and an output nobody can interpret. BioMetriK exists to remove all three.
Every engagement includes a walkthrough of what was fitted, why that model and not another, and what the estimates mean for your selection decisions. Students get a full teaching session.
Your analysis lives as a configured workflow on our platform. Next season’s data runs through exactly the same models and figures, so results stay comparable year on year — without starting from scratch.
Encrypted in transit, access-controlled while we hold it, never reused for anything, and permanently deleted once you have your results.
You stay in control the whole way through, and you only pay once the work is in front of you and you are satisfied with it.
Six broad capabilities covering the analytical work of plant breeding and crop science. Every engagement opens with data QC — cleaning, outliers, assumptions — because that step decides whether the rest holds.
Bring the design you actually used — not the one the software expects.
What is real, what is the field, and how confident you can be in the ranking.
Broad adaptation, specific adaptation, and which of your sites are telling you the same thing twice.
Association and prediction handled honestly, with the assumptions stated rather than buried.
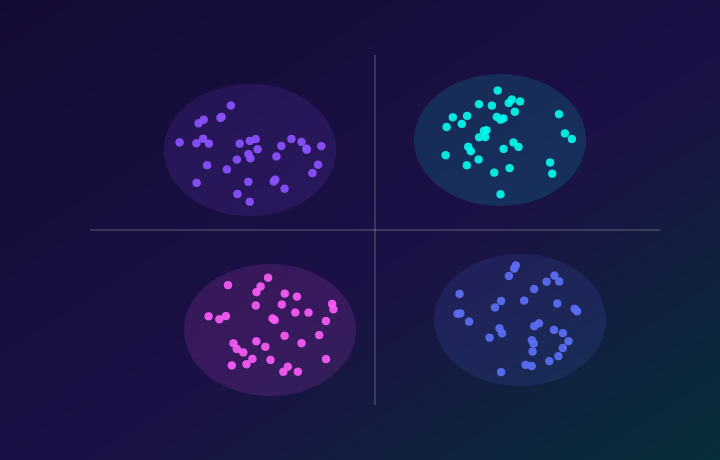
How your material groups, what drives the grouping, and which traits move together.
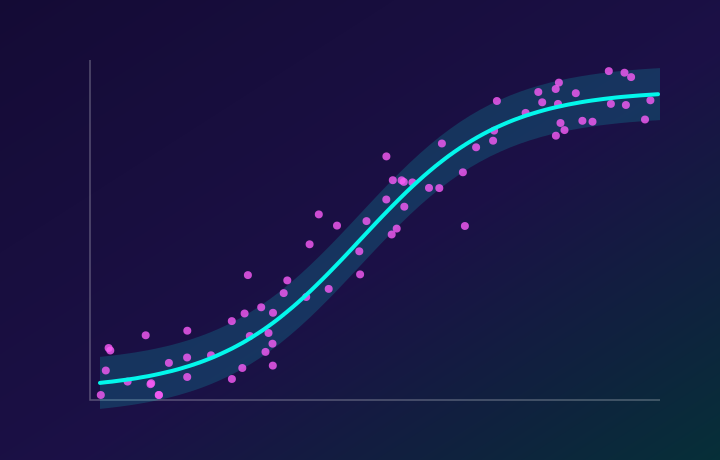
Curves, thresholds and interactions that a linear model flattens out.
The rigour does not change. The pace, the depth of explanation and the shape of the deliverable do. Choose the one that fits you.
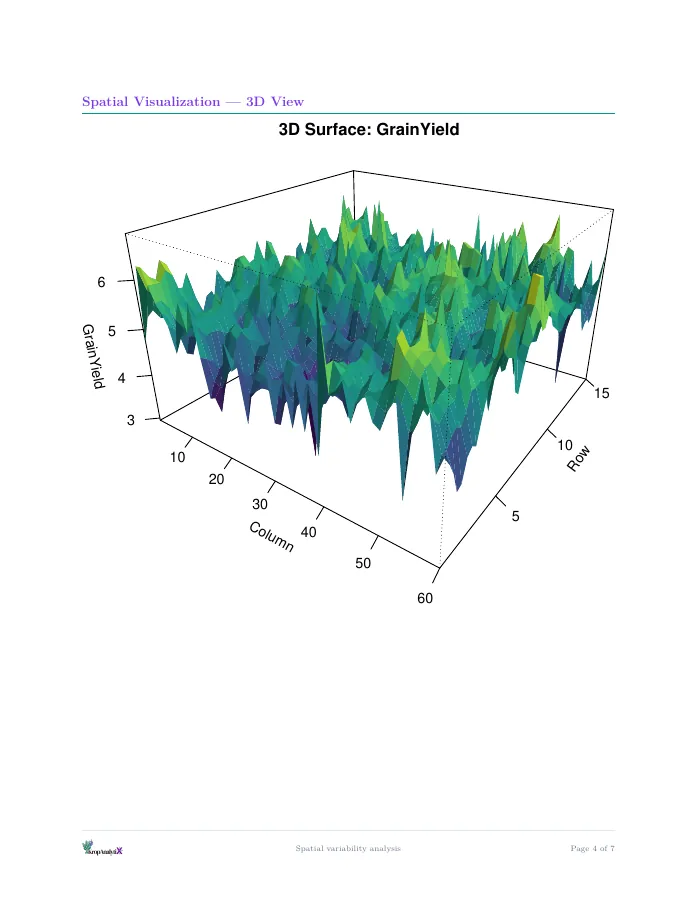
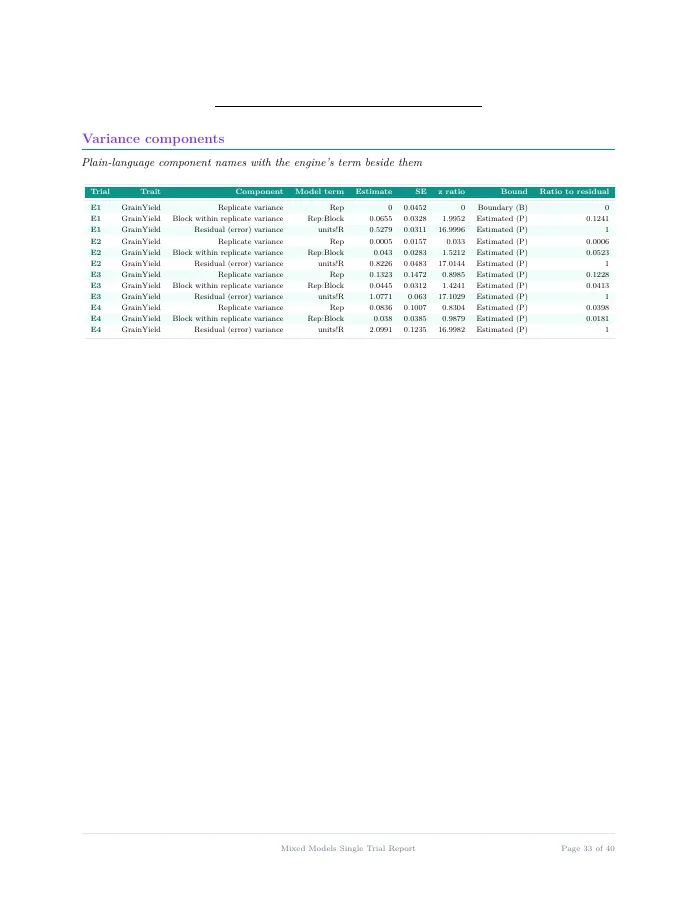
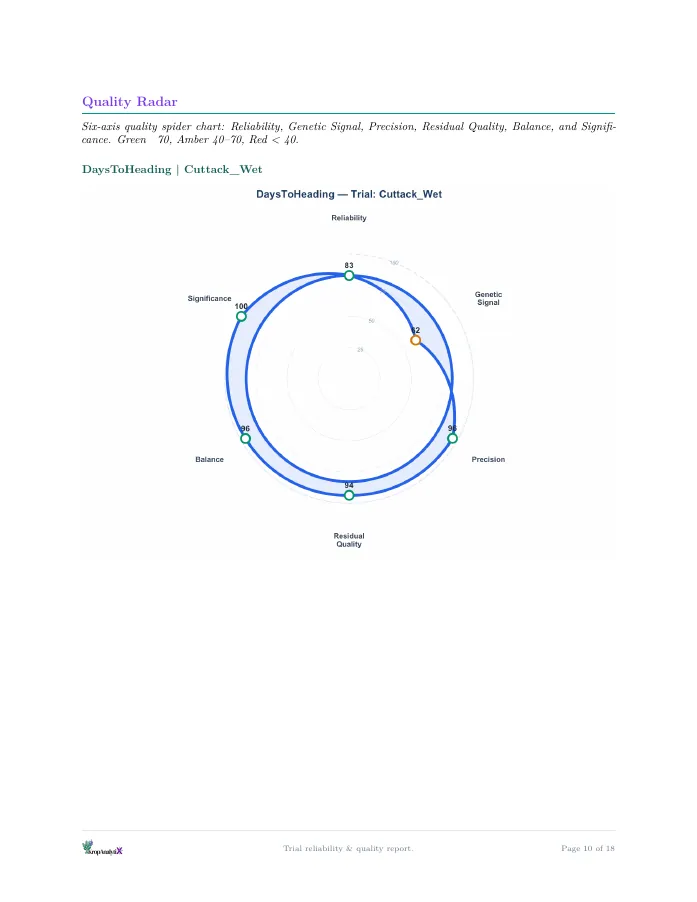
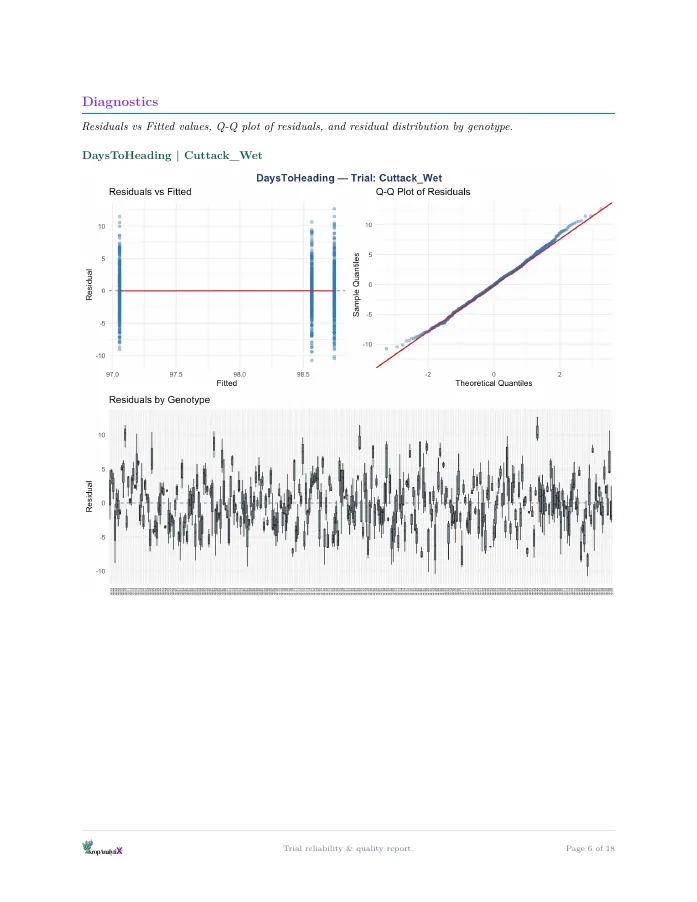
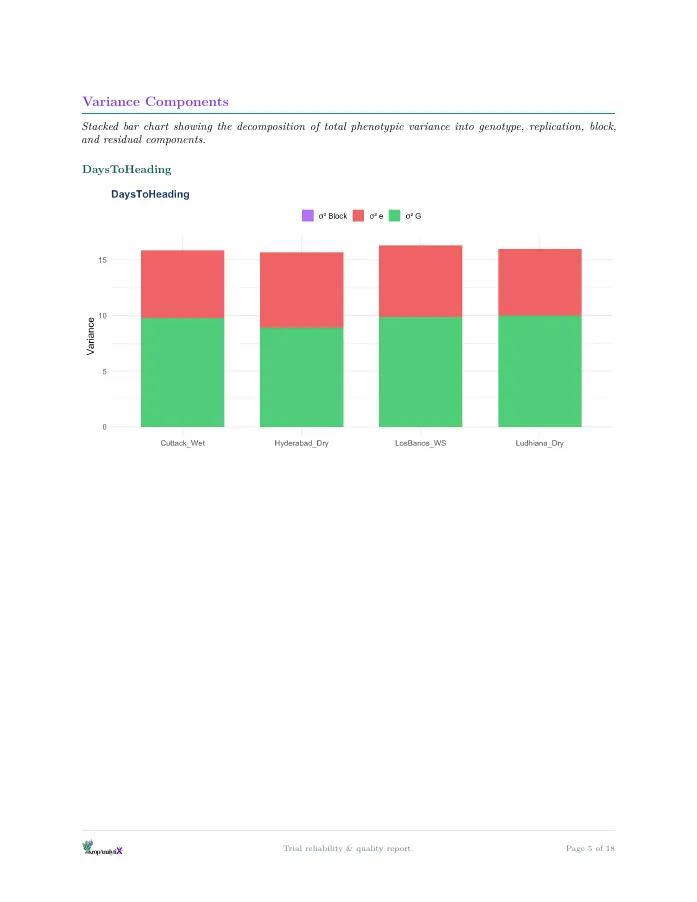
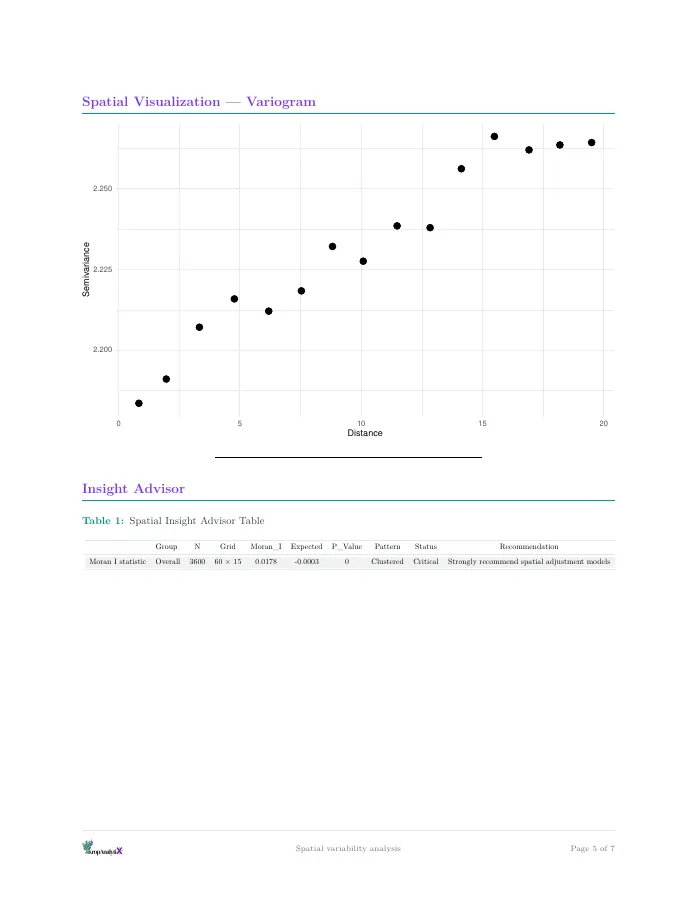
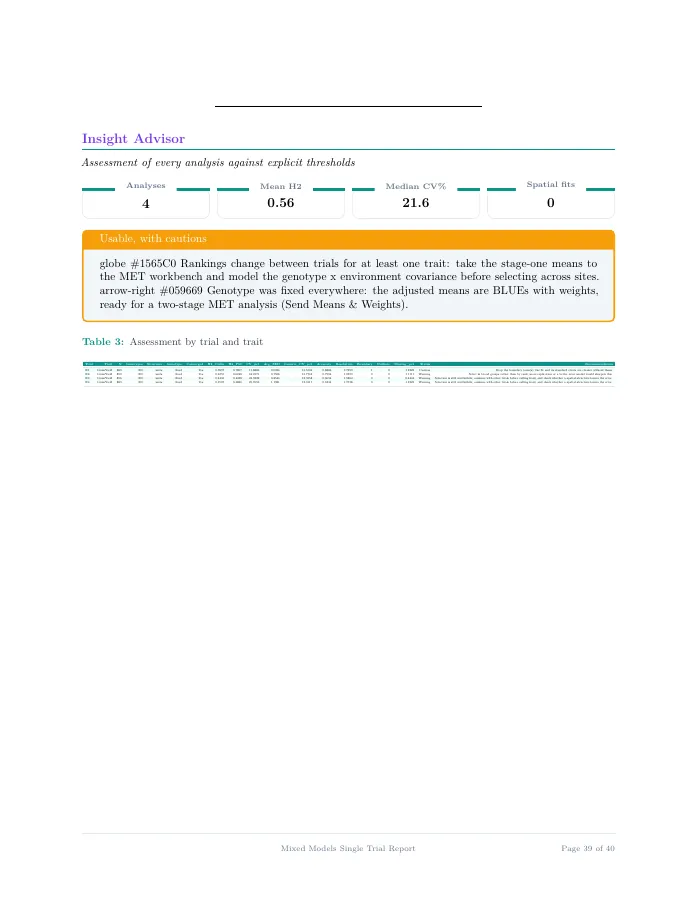
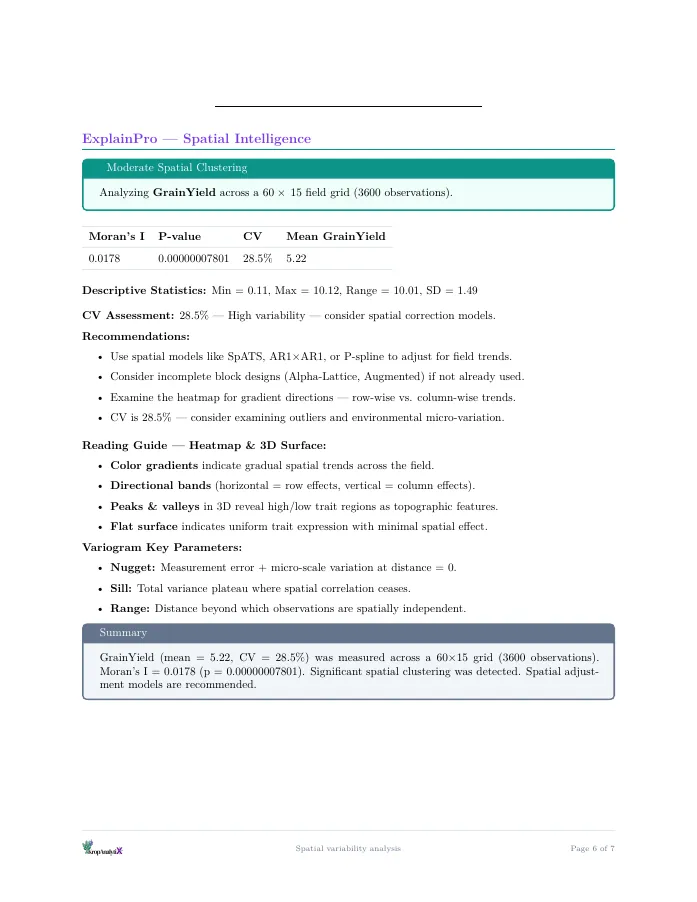
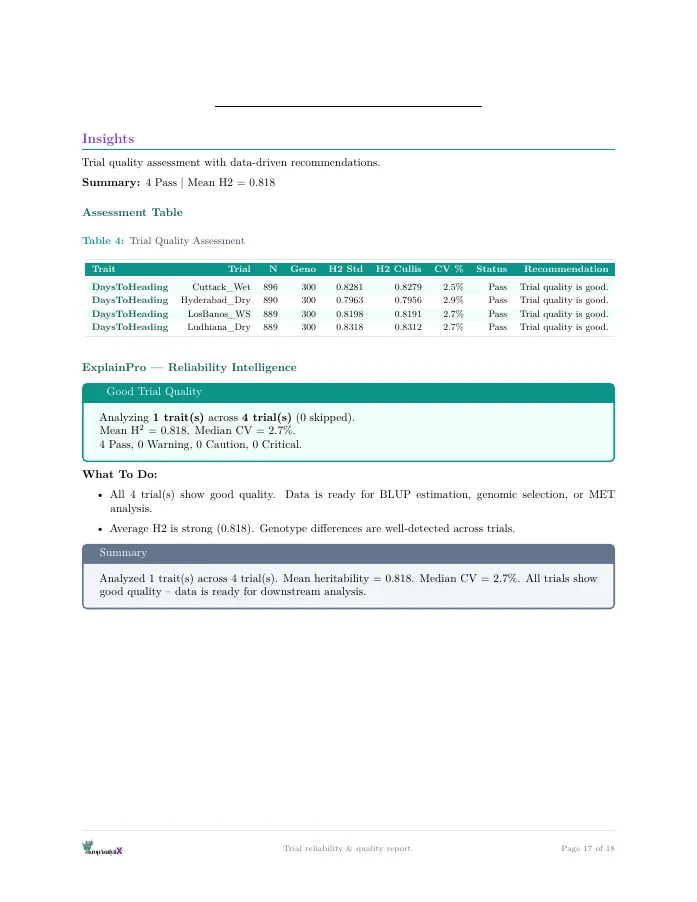
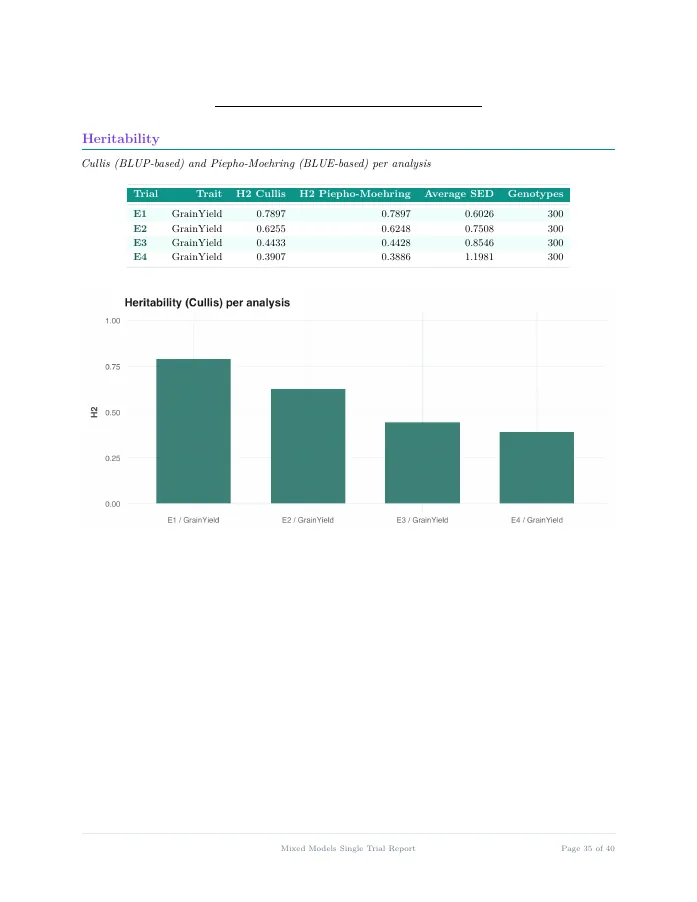
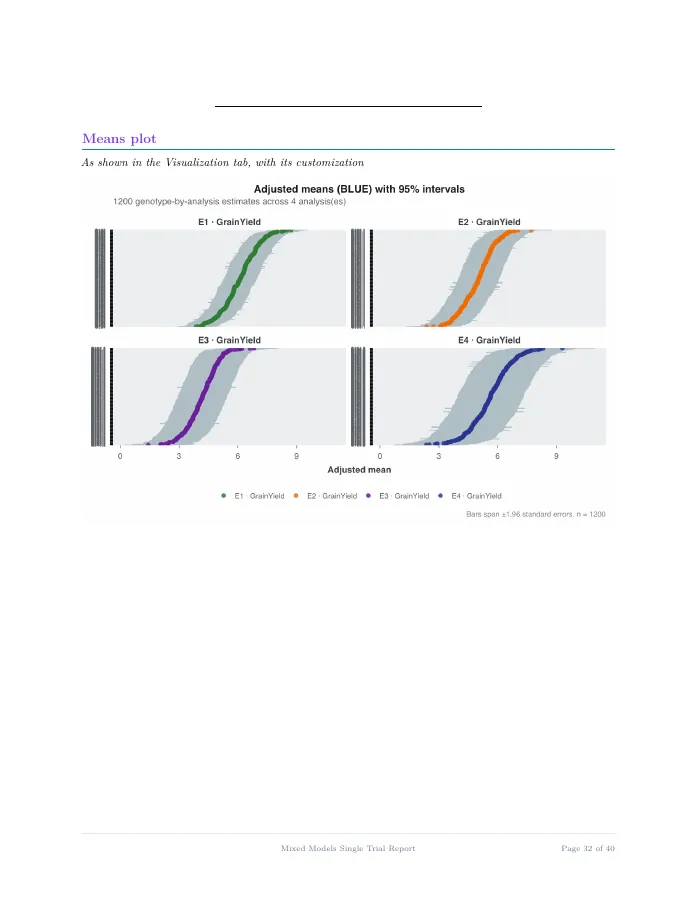
Every engagement ends in a complete report, generated on KropAnalytix — tables, figures and interpretation together. Pages from three sample reports:
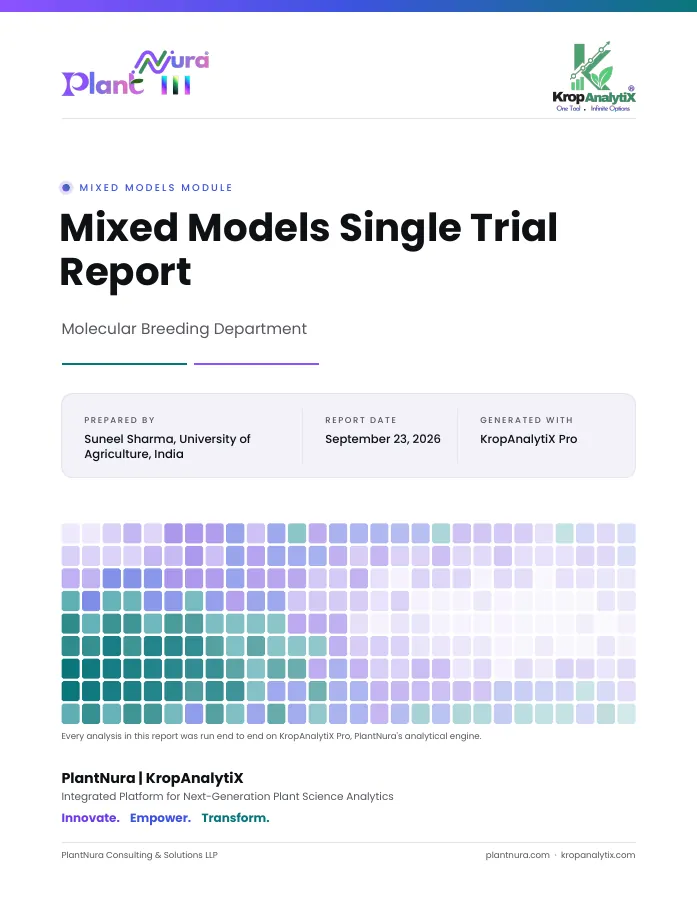
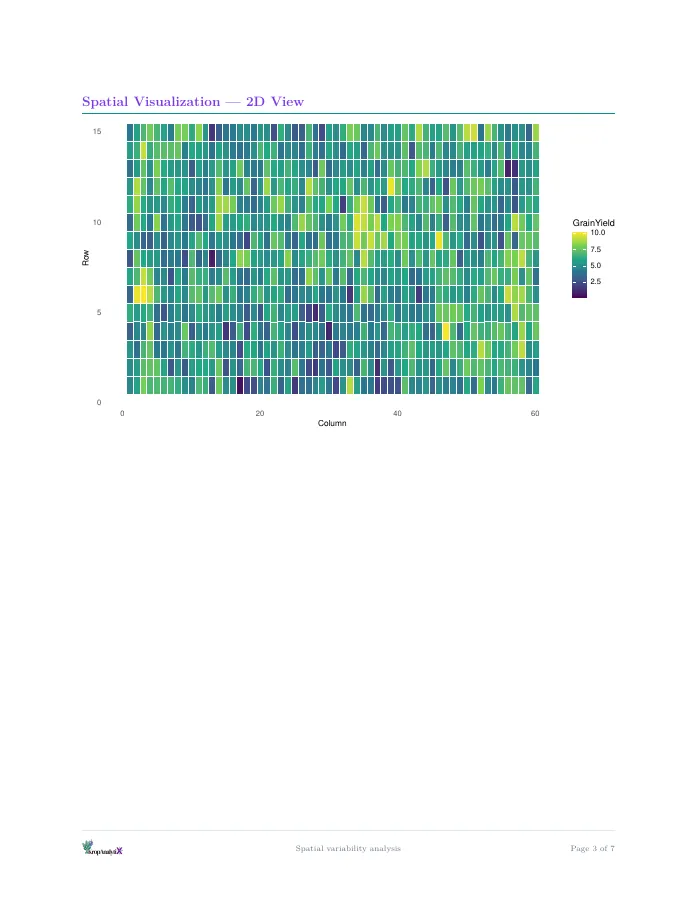
Most consultancies run your data through the same rented packages you could buy yourself. PlantNura built its own — an end-to-end stack from raw field book or marker matrix to genomic prediction and publication figures, in one system. Getting the analysis done is the least of it; the tools it is done with are the difference.
 Launching soon
One platform from design and data checks through mixed models, multi-environment analysis, quantitative genetics and genomic prediction — with the diagnostics beside every fit rather than buried in a log. Built for breeding data, and found nowhere else.
 Launching soon
Manhattan plots, biplots, heatmaps, dendrograms, spatial maps — produced in PlantNura’s own visualisation platform at journal resolution, in a style you can carry across a whole thesis or paper.
A trial dataset is years of crossing, planting and selection. We treat it the way you would: encrypted on the way in, reachable only by the person doing your analysis, never reused for our own work or anyone else's, and permanently deleted once your results are delivered.
Upload → analyse → deliver → delete. That is the whole lifecycle. No archive, no retained backup, no second use.
What you have, what you are trying to answer, and whether the data can answer it. We would rather tell you a design cannot support the question you are asking than fit something that looks like an answer. It is free and carries no obligation.
All of them. Phenotype and field-book data in any spreadsheet or text format (Excel, CSV, tab-delimited), marker data as HapMap, VCF, PLINK or a numeric matrix, and whatever else your programme produces. Send it as it is — we handle the rest.
No. Nothing you receive needs R or any other software: the report, the figures, the results files and the teaching deck open on any computer, and the walkthrough is pitched at whatever level you tell us you are at.
After the walkthrough, once the results are in front of you and you are satisfied with them. Nothing is charged to see whether the work is worth having.
It depends on the data and the analysis, and rates are set with under-resourced programmes and self-funded students in mind. Describe the project and you will get a scoped quote before any work starts.
Yes — journal-formatted figures and a methods section written to be submitted, with the analysis described precisely enough for a reviewer to follow.
Yes. Every report names the platform the analysis ran on — KropAnalytix for the analysis, DataViz Pro for the figures — and both come with online tutorials and documentation, so they can be cited directly in your methods section.
It depends on the data and the question. You get a timeline with the quote, before any work starts, and we hold to it.
Often, yes — lost plots, unbalanced replication, a missing environment. Mixed models recover a great deal, and we tell you first what can and cannot be salvaged.
Yes. Send the manuscript, the comments and the data; we re-run or extend the analysis and give you the revised figures, tables and the wording for your response.
Yes. Everything runs remotely — secure upload, online walkthrough — so location does not matter, and we schedule across time zones.
Often the better answer. If the same analysis is going to recur every season, a training engagement, or one of the courses, leaves the capability inside your group instead of on our invoice.
Yes. Your files are removed from our systems once your results are delivered, and nothing is retained for reuse, training or reference. If you need that stated in a signed agreement, ask and we will put it in one.
Tell us what you have and what you need to conclude from it. We will tell you what is possible, what it involves, and what it will cost — before anything is committed.
Book a free consultation