See the data before you plot it
Profile it, fix it and reshape it in the same workspace — missing values, duplicates, types, joins, long and wide — and convert VCF or HapMap genotypes to the encoding your plot needs.
 Software
DataViz Pro takes your data from the raw file to the finished figure in one no-code workspace. Check, clean and reshape it — genotype files included — then choose from 150+ plot types in 31 modules: from box plots and forty regression views to Manhattan, LD, circos and population-structure plots. Every element is yours to control, and the figure leaves at the size and resolution the journal asks for. AskNura, the assistant built in, sets up plots and explains them, and a project file keeps your data and every figure, ready to rebuild exactly.
A polished scientific figure is rarely one prompt away. DataViz Pro keeps the data, the analysis, the styling and the export in view, with precise controls — so you refine the figure instead of rewriting the request.
Profile it, fix it and reshape it in the same workspace — missing values, duplicates, types, joins, long and wide — and convert VCF or HapMap genotypes to the encoding your plot needs.
150+ plot types, from the everyday to the ones that are hard to draw well: regression diagnostics, spatial field maps, LD blocks, circular Manhattan plots, circos synteny and population structure.
Nine customisation panels, statistics drawn on the plot, and an export set by width, height and DPI. The same controls give the same figure every time — no code, and no guessing.
Every revision is a new request, and the result can change in ways you did not ask for.
Every change is a control you can see, repeat and undo — and the figure you export is the one you approved.
AskNura is part of the app, not a chat window beside it. Ask in your own words; it works DataViz Pro the way you would — and you approve every change.
AskNura is off until you turn it on. It uses your data’s column names and summary figures — never your files or rows — and nothing is used to train AI models. Included in every plan, within a usage allowance.
Each module is a complete workspace for one kind of figure — and most hold many plot types inside. Choose a family to see them.
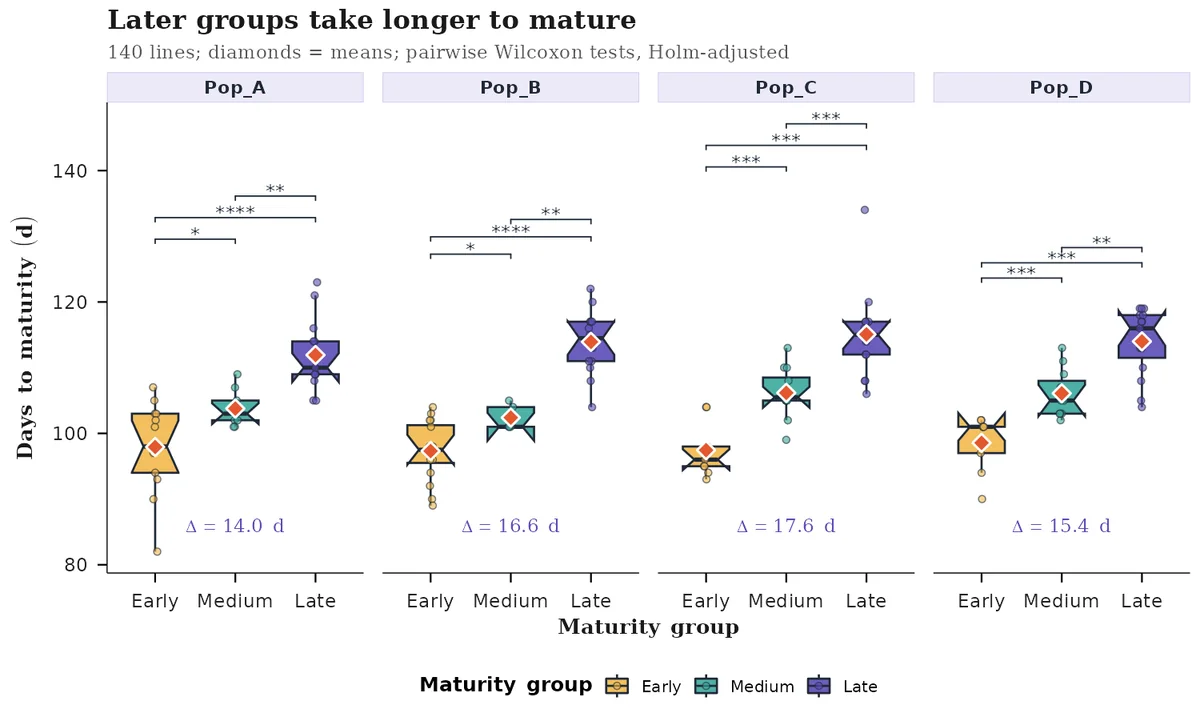
Every figure here is real DataViz Pro output, made from the sample data that ships with the app. Drag the divider to compare the default figure with the same data after customisation, and switch on Interactive to explore it the way the app’s Interactive Mode shows it.


Every figure here, generatedGenerated directly by DataViz Pro.
Most figure problems start in the spreadsheet. The Data Preview workspace loads, checks, cleans, reshapes and converts your data before a single plot is drawn, with an undo for every step — from a 96-plot field trial to genome-wide marker data at gigabyte scale.
DataViz Pro Data Preview
Upload CSV, TXT, TSV or Excel — several files at once — or start from seven curated sample datasets, most of them crop trials. Genotype files and gigabyte-scale datasets have their own entry.
Shown: the Agronomy – RCBD Crop Trial sample, 96 plots × 15 columns.
One click each for summary statistics, structure, missing values, unique values and duplicate rows, plus filters on every column of the data view.
Shown: real values from the RCBD sample — grain yield mean 5.27 t/ha, 24 genotypes, no missing values.
Recode column types, rename and tidy names, find and replace, edit cells, add or remove rows and columns, and fill missing values seven ways. Every change can be undone, ten steps back.
Shown: Replication recoded to a factor, grain yield renamed, “Test Entry” replaced with “Test”.
Sort rows and reorder factor levels, subset by rules, group and aggregate, go long to wide and back, split or join columns, and merge tables by key.
Shown: 96 plots sorted, spread to one row per genotype with Rep1–Rep4, and a genotype mean added.
Detects VCF, HapMap, GBS / TASSEL and numeric matrices, converts them to the encoding you need, filters markers and samples on quality, and sends the genotypes and the marker map to your plots.
Shown: the Crop Diversity Panel (HapMap) sample — 450 SNPs × 120 lines, 2.9% missing calls; all markers pass the default filters.
Export the current view, the original or the filtered data in six formats, so the cleaned table travels with the figure — or open it in any plot module as the current data.
Shown: the genotype-mean table from chapter 04.
Measured on the example file
Big Datasets reads GB-scale files — CSV, TXT, RDS, VCF, HapMap and their gzip-compressed versions — and keeps the data in memory, ready for every plot module, instead of forcing it into a table view.
Example: a sample SNP matrix from the app’s own data, 56.8 MB on disk. Big Datasets takes files many times larger.
Measured on the example file
Twelve tools for data too large to show as a table: preview the first 20 × 20, check the data class, subset, match and reorder, rename, find and replace, impute or drop, switch between matrix and data frame, and transpose — with undo.
Example: the same 844 × 396,511 matrix, turned into 396,511 × 844 and back.
Measured on the example file
Plot modules pick up the stored data with their Big Data button. Genomics Heatmaps reads marker positions from the marker names, analyses up to 20,000 markers chosen evenly per chromosome, and draws the heatmap as a raster image so it stays fast.
Example: VanRaden kinship of 844 lines from 20,000 of the 396,511 SNPs; the Clustering action then splits it into four clusters.
Measured on the example file
VCF and HapMap files can arrive gzip-compressed (.vcf.gz, .hmp.txt.gz). Genotype Conversion detects the format, parses the calls and converts them to 0/1/2, 0/0.5/1, −1/0/1 or 0/1 — in 2,000-marker chunks for large files — then sends the matrix and marker map back to the Data Manager.
Example: the sample panel at 20,000 SNPs × 844 lines as a HapMap .gz (alleles shown as A/G because the source stores 0/1/2 only); the app’s VCF sample as .vcf.gz converts in 0.8 s.
Big-data numbers come from example files — a sample SNP matrix from the app and a HapMap .gz written from it — timed with DataViz Pro’s own code on a 2-CPU cloud test machine (median of three runs). Your files and computer will differ; the sizes shown are examples, not limits.
Nine panels sit beside every plot, in every module, each with its own apply and undo. Even the simplest plot has more than 120 settings before its legend, a GWAS plot has 395, and any title, axis name or annotation can be typeset mathematics.
Five of more than 150 plot types, each taken from one click to a finished figure with the nine panels every module has. Every image is a real DataViz Pro render.
Greek letters, subscripts, hats, fractions, sums — in any title, axis, legend or annotation, on any plot. Typeset in seconds. No LaTeX, no image editor.
Annotations · Scatter Plot1 / 6

Works in every module, standard and genomic. Every figure here was drawn by DataViz Pro from the text typed, with values from the sample data.
No moving data between a spreadsheet, a script and a plotting package — the whole path happens in one workspace. Below, the app’s own screens: a sample dataset, the Scatter Plot module, its panels, and the export panel with the files it wrote.
| Genotypetext | Populationtext | Locationtext | MaturityGrouptext | GrainYield_t_hanumeric | Biomass_t_hanumeric | HarvestIndex_pctnumeric |
|---|---|---|---|---|---|---|
| MT001 | Pop_A | North Farm | Early | 3.6 | 10.93 | 39.9 |
| MT002 | Pop_B | River Site | Medium | 1.82 | 7.25 | 35.7 |
| MT003 | Pop_C | Dryland Station | Medium | 3.61 | 9.89 | 36.3 |
| MT004 | Pop_D | Highland Site | Early | 5.44 | 13.86 | 41.5 |
| MT005 | Pop_A | North Farm | Early | 4.77 | 14.26 | 37.5 |
| MT006 | Pop_B | River Site | Late | 4.42 | 10.62 | 38.5 |
| MT007 | Pop_C | Dryland Station | Late | 5.1 | 9.85 | 43.1 |
| MT008 | Pop_D | Highland Site | Medium | 7.06 | 14.3 | 49.6 |
| … 132 more rows and 22 more columns | ||||||
The files exported in step 4, exactly as the app wrote them: PNG · 4,200 × 3,000 px · 635 KB · PDF · 16 KB · SVG · 154 KB
The Project button keeps your datasets and the settings of every figure in one file, on your computer.
No code to write. No prompts to rephrase. Choose your role.
Start free with Explorer — every module, with our sample data, no time limit, no card. Choose a plan when you want to use your own data, or ask us for a guided demo.
Try every module, free.
Journal-ready figures from your own data.
6-month pass: ₹2,799, one payment, no renewal
Choose ResearcherFor genome-wide marker files.
Need it once? 7-day pass: ₹1,299
Choose Big DataFor research groups, 3–15 seats.
Unlimited users on your domain, priced by how many work at the same time. Single sign-on, invoice or purchase order, a data-processing agreement and a PlantNura training day.
Every session runs in its own private workspace. When it ends, the workspace is removed — and your files with it. Nothing is kept or shared, and your files are never sent to an AI.
What happens to a file you upload
Never used to train AINever sharedNever used for our research
No. DataViz Pro is fully no-code. You load and prepare the data, choose the plot, customise it and export it through the interface — with built-in tutorials inside the modules.
Use each for what it does best. A chat assistant is useful for ideas, or a first draft of plotting code. DataViz Pro is for the figure you publish: it reads your whole dataset — genome-wide marker files included — runs the tests you choose and draws them on the plot, gives the same figure every time you use the same settings, and exports at the exact size and DPI the journal asks for. Your files stay in your own workspace and are never sent to an AI service. If you turn on our optional AskNura assistant, it works from summaries of your data, never the files. Sketch with AI if you like; make the final figure here.
Yes. Explorer is free, with no time limit and no card: every one of the 31 modules, with our built-in sample datasets, and a screen-quality PNG export. To work with your own data, choose Researcher: your files up to 60 MB and full publication export — PNG and JPEG up to 1,200 DPI, PDF and SVG. Want to see it on your own data first? Request a guided demo.
Only the size of the data. Both have every module and every plot, including GWAS, LD and kinship. Researcher runs in the Standard workspace — field trials, expression tables and GWAS results files up to 60 MB. Big Data adds a larger workspace for raw genome-wide marker files: VCF, HapMap or SNP matrices, files up to 2 GB. Need it once? Take a 7-day pass.
Yes. In India, prices are in rupees plus 18% GST, with a GST invoice. Outside India, prices are in US dollars and the price shown is the total you pay. Pick your currency with the India (₹) / International ($) switch above the plans.
31 modules in seven families, holding more than 150 plot types and views between them. Most modules hold many inside: Regression alone has forty views across 13 model families, Population Structure has sixteen, and Circos has nine. The explorer on this page lists them module by module.
CSV, TXT, TSV and Excel for standard data, up to 60 MB per file and several files at once (own files need a paid plan; Explorer uses the sample data). Genotype files as VCF (including .vcf.gz), HapMap or numeric matrices. Very large files up to 2 GB — CSV, TXT, RDS, VCF or HapMap — go through the Big Datasets workflow, on the Big Data plan or a 7-day pass. Seven curated sample datasets are built in.
Yes. Data Preview checks structure, missing values and duplicates; recodes types and values; edits cells, rows, columns and names; fills missing values seven ways; groups, aggregates and subsets; converts long to wide and back; and joins tables by key — with an undo for the last ten steps.
Yes. It detects VCF, HapMap, GBS / TASSEL and numeric formats and converts them to 0/1/2, 0/0.5/1, −1/0/1 or 0/1, with a choice of reference allele, handling for multiallelic sites and IUPAC codes, and quality filters on minor-allele frequency, missingness and heterozygosity. The converted matrix and its marker map go straight to your plots, or out as CSV, TXT or RDS.
Both, where the figure needs it. It runs group comparisons, correlation tests, regression in 13 model families, PCA, clustering, LD and LD-decay fits, kinship and distance matrices, spatial autocorrelation and trend models, and population-structure analyses. For GWAS, QTL and differential-expression plots it draws your completed results — summary statistics, LOD scans or DESeq2, edgeR, limma and Seurat tables.
Yes. The GWAS module draws linear and circular Manhattan plots and Q-Q plots, for one trait or many, with genes or SNPs named on the peaks, annotation tracks and ideograms, highlighted hits and thresholds you set — plus genomic inflation and independent-loci summaries.
Everything on it, through nine panels beside every plot: appearance, grouping and colour, labels with math notation, axis text, 19 themes, legends, multi-panel layouts, annotations and statistics. Each panel has its own apply and undo.
PNG and JPEG at up to 1,200 DPI, and PDF and SVG as vectors, at a width and height you set between 3 and 20 inches — with a preview and an estimated file size before you download. Most modules also have an interactive mode for zooming and hovering on screen.
No. It was built by plant breeders and quantitative geneticists, and its genomic and field modules show it, but the distribution, comparison, relationship, multivariate and heatmap modules serve any data-driven discipline — and the volcano plots read gene-expression and proteomics results.
Yes, please do. Cite it as:
Hussain, W. (2026). DataViz Pro: publication-ready data visualization for plant science (Version 1.2) [Web application]. PlantNura Consulting & Solutions LLP. https://plantnura.com/tools/datavizpro.html
In your methods you can write: “Figures were created with DataViz Pro v1.2 (Hussain, 2026).” The same citation, with a BibTeX entry, is shown in the app while your workspace starts. If you would like the figures made for you, that is part of every BioMetriK Consulting engagement.
No. DataViz Pro runs in a supported web browser as an AWS-hosted application — no local installation, dependencies or manual updates.
Yes. Files move over an encrypted connection into a private workspace that exists only for your session. They are processed inside DataViz Pro and never sent to an AI service or any third party (if you turn on our optional AskNura assistant, only summaries of your data are used to answer you; see the privacy policy), and when the session ends the workspace is removed, with your files. We keep your account, your plan and your session times, not your data. The detail is in our privacy policy, and how the workspace is built is in our article Shiny in production on AWS.
AskNura is an optional assistant inside DataViz Pro that sets up plots, prepares data and explains results, asking before it changes anything. It is off until you turn it on. It works from your messages, the settings you have open, your data’s column names and summary figures, and a plot only when you share it. It never sees your files or data rows. It can read your project’s name and the list of figures, but saving and opening projects stay with you. The privacy policy has the details.
Yes. Press Project at the top right of the app and choose Save: one file with your datasets and the settings of every figure you made downloads to your computer. Later, on any computer, choose Open and each figure is rebuilt exactly, pixel for pixel. Nothing about your data is stored by us; a project file contains your data, so keep it as you keep your data files.
Each figure in the Project panel also has a Settings file: a small file with that figure’s settings, the DataViz Pro version and a fingerprint of your data (column names, size and a one-way code — never the data itself). It is ideal to keep with a manuscript, send to a co-author, or apply the same look to another dataset; Open takes it too.
Yes. Nothing you upload is kept after your session, shared with anyone or used to train models. For extra protection, give lines, markers and samples coded names and keep the key yourself — the figure is the same. Institutes can sign a data-processing agreement before any data is loaded.
Start free with Explorer and try every module on our sample data — or send us a dataset and the figure you have in mind, and we will show you in a guided demo how DataViz Pro gets you there.
Start free Request a demo


